Starting with this article I am introducing a series on an original (at least for me and this blog) topic. Firstly because of the programming language that I’m using to show my idea and secondly because of the subject – melody modification, or to be more precise, sound processing using Python language.
I have written a thesis on this subject in my native language (polish) already, therefore I decided to start this series for the worldwide audience to be able to learn about it.
Theory
First of all we need to introduce a few key concepts so we can transform them into a working application. We need to understand the domains that are sound and signal processing.
Sound
Every sound that we can hear can is really a wave that propagates through the air. It is a change in pressure of air over time.
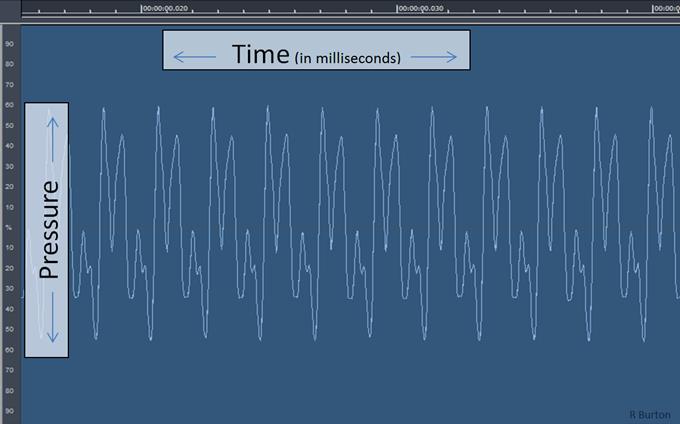
Those changes in pressure, amplitudes can be measured and saved as a file to the computer (as a WAVE file for instance). WAVE file contains a clear information about the amplitudes.
Signal processing
FT & FFT
Ok, we have skimmed the topic already but how to find what frequency we’re hearing at a particular moment in time? We need to use a brilliant method called Fourier Transform (FT) or to be more precise its computer-suited algorithm version called Fast Fourier Transform (FFT). A naive version of this algorithm (FT) is really ineffective and would take too much time to process sound data so that’s where FFT comes in. The history of FT and FFT is a great idea for a different article, though.
Thanks to wiki we can vizualize the idea of FT on charts.
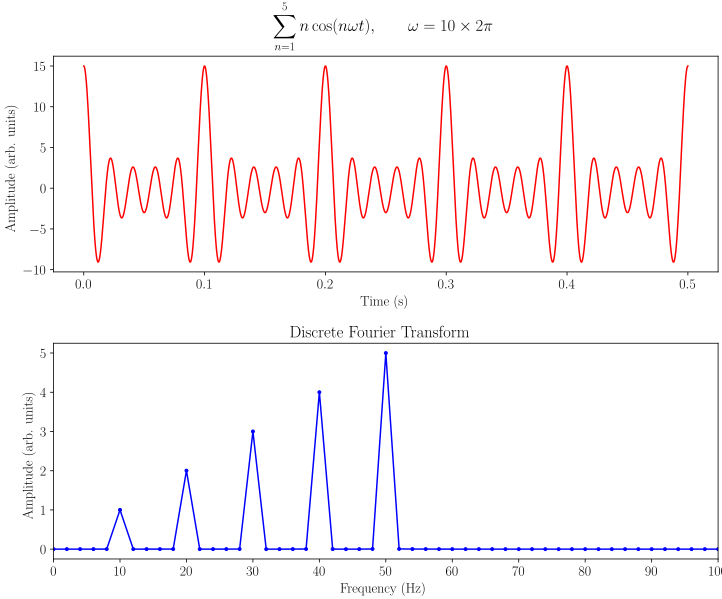
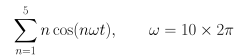
The first figure shows well already known amplitude over time chart for function:
The latter presents the result of the Fourier Transform operator (mathematically FT speaking it’s a linear operator) applied to the sample input shown in the first chart. As a result we get frequencies that make up the input wave and their power in dB.
STFT
We have frequencies of the entire sample but we still don’t know what frequency (note) the sound has at a certain point in time. For that problem, we have to use an another briliant method with a cool acronym Short Time Fourier Transform (STFT). STFT allows us to calculate the frequency and its power in dB at a certain point in time.
A note, for instance a C7 sound, is a sound wave that has the freqeuency of 2093.00 Hz. Table available at https://pages.mtu.edu/~suits/notefreqs.html shows freqiencies for most of the sound notes that a human ear can hear.
The conclusion is that having a value of frequency and its power at a certain point in time allows us to reproduce the melody of the entire sample!
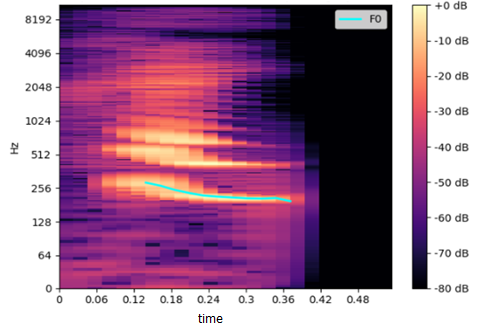
The figure above depicts the result of STFT applied to the sound sample – a spectral analysis. (it’s a different sample, not the same wave as in two previous figures). The green line, labeled as F0, is a chart of the melody computed by the pYIN algorithm. By modyfing the frequencies at certain points in time we can change the melody. Then we just need to use iSTFT (reverse opertion) to acquire modified sound.
Fundamental frequency
One last piece of theory. What is the fundamental frequency labeled as F0?
After wikipedia “the fundamental is the musical pitch of a note that is perceived as the lowest partial present.” Pitch can me mapped to frequency in our terms. Looking at the Fig. 3 we can see the brithest area spanning from around 0.06 to 0.36 s. – the same that has been marked with blue line. This is the lowest frequency of all harmonics at certain point in time. All the higher harmonics (F1, F2) can also be seen in the figure as the brighter stripes (higher power in dB) in higher frequencies.
Implementation
That’s a lot of theory going on behind this concept. Luckily, we have a wonderful Python library that does the math for us so we can just focus on our idea instead of implementing it by hand (that would be fun too though). librosa is a rich library for music and audio analysis. We just need to get Python, install it, then get librosa and install it too. I am using JetBrains’ PyCharm which makes it quite easy to do but you are free to choose your favorite IDE.
PyCharm
Once you have acquired PyCharm go to File -> Settings.
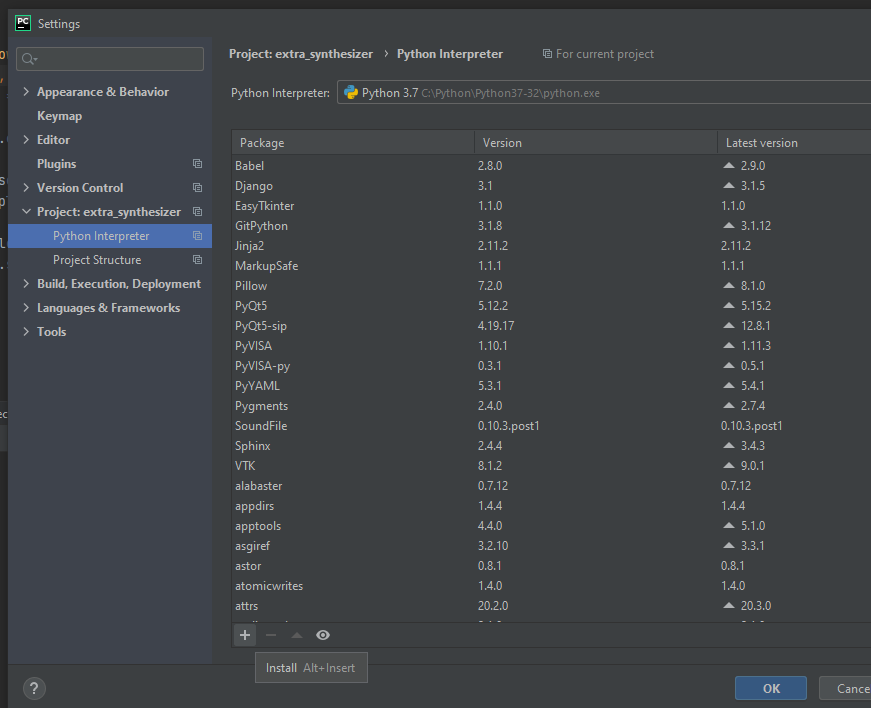
Then choose Python interpreter and click on a ‘plus’ sign. Type in ‘librosa’ and choose the latest version (0.8.0 at the time of writing this). Click Install package, then OK, wait for it to be installed and you are good to go.
Another libs that should be installed for showing a plot are ‘matplotlib‘ and ‘numpy‘. Repeat the steps above and install the newest version.
Testing librosa
Create a new .py file and write the code below.
import librosa
from librosa import display
import matplotlib.pyplot as plt
import numpy as np

fig, ax = plt.subplots()

y, sr = librosa.load(librosa.ex('trumpet'))
stft_absolute_values = np.abs(librosa.stft(y))
img = display.specshow(librosa.amplitude_to_db(stft_absolute_values, ref=np.max), y_axis='log', x_axis='time', ax=ax)

ax.set_title('Power spectrogram')

fig.colorbar(img, ax=ax, format="%+2.0f dB")
plt.show()
Run the code and voila! We have quickly transformed sound waves to frequencies and created a really neat diagram using Python and librosa. Good job.
This is where I stop. In the next part I am going to show you an actual implementation of melody modification code, samples conversion using STFT and vice versa. Explain thoroughly how to read, understand end modify the results of Fourier Transformation. Hope to see you there!
Should you any questions or remarks, feel free to reach me!
[…] In the second part of the series I am going to present you an implementation of the melody modification method I’ve described in the first part. Available here. […]